Menu Close

Category: GIS

GIS, or Geographic Information Systems, store information tied to a location. The archival preservation of GIS data is an ongoing challenge.

Chapter 7: Historical Building Information Model (BIM)+: Sharing, Preserving and Reusing Architectural Design Data by Dr. JuHyun Lee and Dr. Ning Gu

Chapter 7 of Partners for Preservation is ‘Historical Building Information Model (BIM)+: Sharing, Preserving and Reusing Architectural Design Data’ by Dr. JuHyun Lee and Dr. Ning Gu. The final chapter in Part II: The physical world: objects, art, and architecture, this chapter addresses the challenges of digital records created to represent physical structures. I picked the image above because I love the contrast between the type of house plans you could order from a catalog a century ago and the way design plans exist today.

This chapter was another of my “must haves” from my initial brainstorm of ideas for the book. I attended a session on ‘Preserving Born-Digital Records Of The Design Community’ at the 2007 annual SAA meeting. It was a compelling discussion, with representatives from multiple fields. Archivists working to preserve born-digital designs. People working on building tools and setting standards. There were lots of questions from the audience – many of which I managed to capture in my notes that became a detailed blog post on the session itself. It was exciting to be in the room with so many enthusiastic experts in overlapping fields. They were there to talk about what might work long term.

This chapter takes you forward to see how BIM has evolved – and how historical BIM+ might serve multiple communities. This passage gives a good overview of the chapter:

“…the chapter first briefly introduces the challenges the design and building industry have faced in sharing, preserving and reusing architectural design data before the emergence and adoption of BIM, and discusses BIM as a solution for these challenges. It then reviews the current state of BIM technologies and subsequently presents the concept of historical BIM+ (HBIM+), which aims to share, preserve and reuse historical building information. HBIM+ is based on a new framework that combines the theoretical foundation of HBIM with emerging ontologies and technologies in the field including geographic information systems (GIS), mobile computing and cloud computing to create, manage and exchange historical building data and their associated values more effectively.”

I hope you find the ideas shared in this chapter as intriguing as I do. I see lots of opportunities for archivists to collaborate with those focused on architecture and design, especially in the case of historical buildings and the proposed vision for HBIM+.

Bios:

Ning Gu is Professor of Architecture in the School of Art, Architecture and Design at the University of South Australia. Having an academic background from both Australia and China, Professor Ning Gu’s most significant contributions have been made towards research in design computing and cognition, including topics such as computational design analysis, design cognition, design com­munication and collaboration, generative design systems, and Building Information Modelling. The outcomes of his research have been documented in over 170 peer-reviewed publications. Professor Gu’s research has been supported by prestigious Australian research funding schemes from Australian Research Council, Office for Learning and Teaching, and Cooperative Research Centre for Construction Innovation. He has guest edited/chaired major international journals/conferences in the field. He was Visiting Scholar at MIT, Columbia University and Technische Universiteit Eindhoven.

JuHyun Lee is an adjunct senior lecturer, at the University of Newcastle (UoN). Dr. Lee has made a significant contribution towards architectural and design research in three main areas: design cognition (design and language), planning and design analysis, and design computing. As an expert in the field of architectural and design computing, Dr. Lee was invited to become a visiting academic at the UoN in 2011. Dr. Lee has developed innovative computational applications for pervasive computing and context awareness in the building environments. The research has been published in Computers in Industry, Advanced Engineering Informatics, Journal of Intelligent and Robotic Systems. His international contribution has been recognised as: Associate editor for a special edition of Architectural Science Review; Reviewer for many international journals and conferences; International reviewer for national grants.

Image Source: Image from page 717 of ‘Easy steps in architecture and architectural drawing’ by Hodgson, Frederick Thomas, 1915. https://archive.org/details/easystepsinarch00hodg/page/n717

The CODATA Mission: Preserving Scientific Data for the Future

The North Jetty near the Mouth of the Columbia River 05/1973This session was part of The Memory of the World in the Digital Age: Digitization and Preservation conference and aimed to describe the initiatives of the Data at Risk Task Group (DARTG), part of the Committee on Data for Science and Technology (CODATA), a body of the International Council for Science.

The goal is to preserve scientific data that is in danger of loss because they are not in modern electronic formats, or have particularly short shelf-life. DARTG is seeking out sources of such data worldwide, knowing that many are irreplaceable for research into the long-term trends that occur in the natural world.

Organizing Data Rescue

The first speaker was Elizabeth Griffin from Canada’s Dominion Astrophysical Observatory. She spoke of two forms of knowledge that we are concerned with here: the memory of the world and the forgettery of the world. (PDF of session slides)

The “memory of the world” is vast and extends back for aeons of time, but only the digital, or recently digitized, data can be recalled readily and made immediately accessible for research in the digital formats that research needs. The “forgettery of the world” is the analog records, ones that have been set aside for whatever reason, or put away for a long time and have become almost forgotten.  It the analog data which are considered to be “at risk” and which are the task group’s immediate concern.

Many pre-digital records have never made it into a digital form.  Even some of the early digital data are insufficiently described, or the format is out of date and unreadable, or the records cannot be located at all easily.

How can such “data at risk” be recovered and made useable?  The design of an efficient rescue package needs to be based upon the big picture, so a website has been set up to create an inventory where anyone can report data-at-risk. The Data-at-Risk Inventory (built on Omeka) is front-ended by a simple form that asks for specific but fairly obvious information about the datasets, such as field (context), type, amount or volume, age, condition, and ownership. After a few years DARTG should have some better idea as to the actual amounts and distribution of different types of historic analog data.

Help and support are needed to advertise the Inventory.  A proposal is being made to link data-rescue teams from many scientific fields into an international federation, which would be launched at a major international workshop.  This would give a permanent and visible platform to the rescue of valuable and irreplaceable data.

The overarching goal is to build a research knowledge base that offers a complimentary combination of past, present and future records.  There will be many benefits, often cross-disciplinary, sometimes unexpected, and perhaps surprising.  Some will have economic pay-offs, as in the case of some uncovered pre-digital records concerning the mountain streams that feed the reservoirs of Cape Town, South Africa.  The mountain slopes had been deforested a number of years ago and replanted with “economically more appealing” species of tree.  In their basement hydrologists found stacks of papers containing 73 years of stream-flow measurements.  They digitized all the measurements, analyzed the statistics, and discovered that the new but non-native trees used more water.  The finding clearly held significant importance for the management of Cape Town’s reservoirs.  For further information about the stream-flow project see Jonkershoek – preserving 73 years of catchment monitoring data by Victoria Goodall & Nicky Allsopp.

DARTG is building a bibliography of research papers which, like the Jonkershoek one, describe projects that have depended partly or completely on the ability to access data that were not born-digital.  Any assistance in extending that bibliography would be greatly appreciated.

Several members of DARTG are themselves engaged in scientific pursuits that seek long-term data.  The following talks describe three such projects.

Data Rescue to Increase Length of the Record

The second speaker, Patrick Caldwell from the US National Oceanographic Data Center (NODC), spoke on rescue of tide gauge data. (PDF of full paper)

He started with an overview of water level measurement, explaining how an analog trace (a line on a paper style record generated by a float w/a timer) is generated. Tide gauges include geodetic survey benchmark to make sure that the land isn’t moving. The University of Hawaii maintains a network of gauges internationally. Back in the 1800s, they were keeping track of the tides and sea level for shipping. You  never know what the application may turn into – they collected for tides, but in the 1980s they started to see patterns. They used tide gauge measurements to discover El Niño!

As you increase the length of the record, the trustworthiness of the data improves. Within sea level variations, there are some changes that are on the level of decades. To take that shift out, they need 60 years to track sea level trends. They are working to extend the length of the record.

The UNESCO Joint Technical Commission for Oceanography & Marine Meteorology has  Global Sea Level Observing System (GLOSS)

GLOSS has a series of Data Centers:

  • Permanent Service for Mean Sea Level (monthly)
  • Joint archive for sea level (hourly)
  • British Oceanographic Data center (high frequency)

The biggest holding starts at 1940s. They want to increase the number of longer records. A student in France documented where he found records as he hunted for the data he needed. Oregon students documented records available at NARA.

Global Oceanographic Data Archaeology and Rescue (GODAR) and the World Ocean Database Project

The Historic Data Rescue Questionnaire created in November 2011 resulted in 18 replies from 14 countries documenting tide gauge sites with non-digital data that could be rescued. They are particularly interested in the records that are 60 years or more in length.

Future Plans: Move away from identifying what is out there to tackling the rescue aspect. This needs funding. They will continue to search repositories for data-at-risk and continue collaboration with GLOSS/DARTG to freshen on-line inventory. Collaborate with other programs (Atmospheric Circulation Reconstructions over the Earth (ACRE) meeting 11-2012). Eventually move to Phase II = recovery!

The third speaker, Stephen Del Greco from the US NOAA National Climatic Data Center (NCDC), spoke about environmental data through time and extending the climate record. (PDF of full paper) The NCDC is a weather archive with headquarters in Asheville, NC. It fulfills much of the nation’s climate data requirements. Their data comes from many different sources. Safe storage of over 5,600 terabytes of climate data (= 6.5 billion kindle books). How will they handle the upcoming explosion of data on the way? Need to both handle new content coming in AND provide increased access to larger amounts of data being downloaded over time. 2011 number = data download of 1,250 terabytes for the year. They expect that download number to increase 10 fold over the next few years.

The climate database modernization program went on over more than a decade rescuing data. It was well funded and millions of records were rescued with a budget of roughly 20 Million a year. The goal is to preserve and make major climate and environmental data available via the World Wide Web. Over 14 terabytes of climate data are now digitized. 54 million weather and environmental images are online. Hundreds of millions of records are digitized and now online. The biggest challenge was getting the surface observation data digitized. NCDC digital data for hourly surface observations generally stretch back to around 1948. Some historical marine observations go back to the spice trade records.

For international efforts they bring their imaging equipment to other countries where records were at risk. 150,000 records imaged under the Climate Database Modernization Program (CDMP).

Now they are moving from public funding to citizen-fueled projects via crowdsourcing such as the Zooniverse Program. Old Weather is a Zooniverse Project which uses crowdsourcing to digitize and analyze climate data. For example, the transcription done by volunteers help scientists model Earth’s climate using wartime ship logs. The site includes methods to validate efforts from citizens.  They have had almost 700,000 volunteers.

Long-term Archive Tasks:

  • Rescuing Satellite Data: raw images in lots of different film formats. All this is at risk. Need to get it all optically imaged. Looking at a ‘citizen alliance’ to do this work.
  • Climate Data Records: Global Essential Climate Variables (ECVs) with Heritage Records. Lots of potential records for rescue.
  • Rescued data helps people building proxy data sets: NOAA Paleoclimatology. ‘Paleoclimate proxies’ – things like boreholes, tree rings, lake levels, pollen, ice cores and more. For example – getting temperate and carbon dioxide from ice cores. These can go back 800,000 years!

We have extended the climate record through international collaboration. For example, the Australian Bureau of Meteorology provided daily temperature records for more than 1,500 additional stations. This meant a more than 10-fold increase in previous historical climate daily data holdings from that country.

Born Digital Maps

The final presentation discussed the map as a fundamental source of memory of the world, delivered by D. R. Fraser Taylor and Tracey Lauriault from Carleton University’s Geomatics and Cartographic Research Center in Canada. The full set of presentation slides are available online on SlideShare. (PDF of full paper)

We are now moving into born digital maps. For example, the Canadian Geographic Information System (CGIS) was created in the 1960s and was the worlds 1st GIS. Maps are ubiquitous in the 21st century. All kinds of organizations are creating their own maps and mash-ups. Community based NGOs, citizen science, academic and private sector are all creating maps.

We are loosing born digital maps almost faster than we are creating them. We have lost 90% of the born digital maps. Above all there is an attitude that preservation is not intrinsically important. No-one thought about the need to preserve the map – everyone thought someone else would do it. There was a complete lack of thought related to the preservation of these maps.

The Canada Land Inventory (CLI) was one of the first and largest born digital map efforts in the world. Mapped 2.6 million square kilometers of Canada. Lost in the 1980s. No-one took responsibility for archiving. Those who thought about it believed backup equaled archiving. A group of volunteers rescued the process over time – salvaged from boxes of tapes and paper in mid-1990s. It was caught just in time and took a huge effort. 80% has been saved and is now it is online. This was rescued because it was high profile. What about the low-profile data sets? Who will rescue them? No-one.

The 1986 BBC Doomsday Book was created in celebration of 900 years after William the Conqueror’s original Domesday Book. It was obsolete by the 1990s. A huge amount of social and economic information was collected for this project. In order to rescue it they needed an acorn computer and needed to be able to read the optical disks. The platform was emulated in 2002-2003. It cost 600,000 british pounds to reverse engineer and put online in 2004. New discs made in 2003 at the UK Archive.

It is easier to get Ptolomy’s maps from 15th century than it is to get a map 10 years old.

The Inuit Siku (sea ice) Atlas, an example of a Cybercartographic atlas, was produced in cooperation with Inuit communities. Arguing that the memory of what is happening in the north lies in the minds of the elders, they are capturing the information and putting it out in multi-media/multi-sensory map form. The process is controlled by the community themselves. They provide the software and hardware. They created a graphic tied to the Inuit terms for different types of sea ice. In some cases they record the audio of an elder talking about a place. The narrative of the route becomes part of the atlas. There is no right or wrong answer. There are many versions and different points of view. All are based on the same set of facts – but they come from different angles. The atlases capture them all.

The Gwich’in Place Name Atlas is building in the idea of long term preservation into the application from the start

The Cybercartographic Atlas of the Lake Huron Treaty Relationship Process is taking data from surveyors diaries from the 1850s.

There are lots of government of Canada geospatial data preservation intitatives, but in most cases there is a lot of retoric, but not so much action. There have been many consultations, studies, reports and initiatives since 2002, but the reality is that apart from the Open Government Consultations (TBS), not very much as translated into action. Even in the case where there is legislation, lots of things look good on paper but don’t get implemented.

There are Library and Archives Guidelines working to support digital preservation of geospatial data. The InterPares 2 (IP2) Geospatial Case Studies tackle a number of GIS examples, including the Cybercartographic Atlas of Antartica. See the presentation slides online for more specific examples.

In general, preservation as an afterthought rarely results in full recovery of born digital maps. It is very important to look at open source and interoperable open specifications. Proactive archiving is an important interim strategy.

Geospatial data are fundamental sources of our memory of the world. They help us understand our geo-narratives (stories tied to location), counter colonial mappings, are the result of scientific endeavors, represent multiple worldviews and they inform decisions. We need to overcome the challenges to ensure their preservation.

Q&A:

QUESTION: When I look at the work you are doing with recovering Inuit data from people. You recover data and republish it – who will preserve both the raw data and the new digital publication? What does it mean to try and really preserve this moving forward? Are we really preserving and archiving it?

ANSWER: No we are not. We haven’t been able to find an archive in Canada that can ingest our content. We will manage it ourselves as best we can. Our preservation strategy is temporary and holding, not permanent as it should be. We can’t find an archive to take the data. We are hopeful that we are moving towards finding a place to keep and preserve it. There is some hope on the horizon that we may move in the right directions in the Canadian context.

Luciana: I wanted to attest that we have all the data from InterPARES II. It is published in the final. I am jealously guarding my two servers that I maintain with money out of my own pocket.

QUESTION: Is it possible to have another approach to keep data where it is created, rather than a centralized approach?

ANSWER: We are providing servers to our clients in the north. Keeping copies of the database in the community where they are created. Keeping multiple copies in multiple places.

QUESTION: You mention surveys being sent out and few responses coming back. When you know there is data at risk – there may be governments that have records at risk that they are shy to reveal to the public? How do we get around that secrecy?

ANSWER: (IEDRO representative) We offer our help, rather than a request to get their data.

As is the case with all my session summaries, please accept my apologies in advance for any cases in which I misquote, overly simplify or miss points altogether in the post above. These sessions move fast and my main goal is to capture the core of the ideas presented and exchanged. Feel free to contact me about corrections to my summary either via comments on this post or via my contact form.

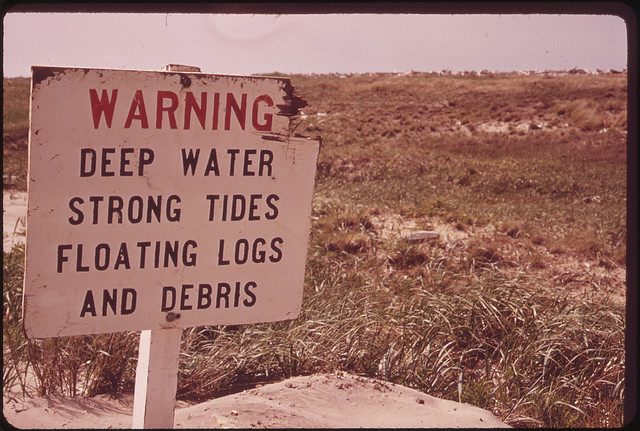
Image Credit: NARA Flickr Commons image “The North Jetty near the Mouth of the Columbia River 05/1973”

Updated 2/20/2013 based on presenter feedback.

Creative Funding for Text-Mining and Visualization Project

The Hip-Hop word count project on Kickstarter.com caught my eye because it seems to be a really interesting new model for funding a digital humanities project. You can watch the video below – but the core of the project tackles assorted metadata from 40,000 rap songs from 1979 to the present including stats about each song (word count, syllables, education level, etc), individual words, artist location and date. This information aims to become a public online almanac fueled by visualizations.

I am a backer of this project, and you can be too. As of the original writing of this post, they are currently 47% funded twenty-eight days out from their deadline. For those of you not familiar with Kickstarter, people can post creative projects and provide rewards for their funders. The funding only goes through if they reach their goal within the time limit – otherwise nothing happens, a model they call ‘all-or-nothing funding’.

What will the money be spent on?

  • 45% for PHP programmers who have been coding the custom web interface
  • 35% for interface designers
  • 10% for data acquisition & data clean up
  • 10% for hosting bills

They aim for a five month time-line to move from their existing functional prototype to something viable to release to the public.

I am also intrigued by ways that the work on this project might be leveraged in the future to support similar text-mining projects that tie in location and date. How about doing the same thing with civil war letters? How about mining the lyrics from Broadway musical songs?

If this all sounds interesting, take a look at the video below and read more on the Hip-Hop Word Count Kickstarter home page. If half the people who follow my RSS feed pitch in $10, this project would be funded. Take a look and consider pitching in. If this project doesn’t speak to you – take a look around Kickstarter for something else you might want to support.

National Archives Transitions to Flickr Commons Membership

Ladies in Gas Masks

Even with the recent announcement that the Flickr Commons is not currently accepting new applications, there are clearly still applications being processed. NARA has been on Flickr since February of 2009 and loaded 49 sets of images. As announced in a recent press release, on the first of February 2010 Flickr flipped the switch and all the images in the The U.S. National Archives’ photostream was shifted over into the Commons.

The 49 sets are sorted into 4 collections:

  • Historical Photographs and Documents (19 sets) – including NARA favorites like Rosie the Riveter and Nixon and Elvis and documents from regional archives across the country.
  • DOCUMERICA Project by the Environmental Protection Agency (27 sets) – one set dedicated to top picks and the rest organized by photographer. Interestingly, NARA’s website has indexed the 15,000+ images from this project by subject and by location. I wonder how the picked which image from DOCUMERICA to port over to Flickr?
  • Mathew Brady Civil War Photographs (2 sets) – currently 473 out of the 6,066 digitized Mathew Brady images are uploaded into the Commons. The images posted in the Commons are available in a much higher resolution than they are within ARC. A great example from this collection is the image of the Poplar Church (image shown to right) available as a 600 x 483 GIF on ARC and as a 3000 x 2416 JPG on Flickr. This image also has gotten a nice set of comments and tags.
  • Development and Public Works (1 set) – the only set in this collection consists of images taken to support the Flathead Irrigation Project. “The Project was initiated to determine rights and distribute water originating on the Flathead Indian Agency in Montana to both tribal and non-tribal land.” These images seem to be the same resolution on both archives.gov and Flickr.

In honor of this transition, NARA posted a new set of 220 Ansel Adams photographs. One of the first comments on the set was “low-res scans? Pretty big letdown.” Fine question. As noted above, other images from NARA in the Commons much larger than the 600 x 522 that seems to be available for the Ansel Adams images. It would be great to have a clear explanation about available resolutions published along with each new set of images.

NARA has published this simple rights statement for all NARA images in the Commons:

All of the U.S. National Archives’ images that are part of The Flickr Commons are marked “no known copyright restrictions.” This means the U.S. National Archives is unaware of any copyright restrictions on the publication, distribution, or re-use of those particular photos. Their use restriction status in our online catalog is “unrestricted.” Therefore, no written permission is required to use them.

NARA has also posted an official Photo Comment and Posting Policy and a fairly extensive FAQ about the images they have post on Flickr. I do wish that there was a simpler way to request reprints of images from the Commons. Most of the NARA images have this standard sentence – but for someone not familiar with NARA and more accustom to one click ordering, the instructions seem very complex:

For information about ordering reproductions of photographs held by the Still Picture Unit, visit: www.archives.gov/research/order/still-pictures.html

I also wish that more of the images had location information assigned – only 113 of the images show up on the fun to explore map view. At first glance it looks as if this information is populated only for images taken near airports. There are many images that include a location based subject in the image description posted on Flickr, yet do not include geographic metadata that would permit the image to be shown on a map. The one image I did find that was not at an airport but did include geographic metadata is this image of the World Trade Center assigned to the NYC Financial District Flickr Location. While I could add a location related tag to NARA’s images, there does not appear any way for the general public to suggest location metadata.

One odd note about this and other World Trade Center images – the auto-generated tags have broken up the building name very oddly as shown in my screen clip on the left.

Another fun way way to explore the NARA Flickr images is to visit the ‘Archives’ page (slightly hilariously titled “U.S. National Archives’ Archives”). Here we can browse photos based on when they were uploaded to Flickr or when they were taken. Those images that include a specific date can be viewed on a calendar (such as these images from 1918) or in a list view (those same images from 1918 as a list), while those taken ‘circa’ a year can be viewed in a list with all other images from sometime that year (such as these images from circa 1824).

Beyond all the additional tags and content collected via comments on these images, I think that being able to find NARA images based on a map, calendar or tag is the real magic of the commons. The increased opportunities for access to these images cannot be overstated.

Take this image of a sunflower. If you visit this image on archives.gov, you can certainly find the image and view it – but good luck finding all the images of flowers as quickly as this Flickr tag page for NARA images of flowers can. Even looking at the special Documerica by Topic page doesn’t get me much closer to finding an image of a flower.

It will be fun to watch what else NARA chooses to upload to the Commons. I vote for more images that are assigned metadata such that they show up on the map and calendar. I will also put your mind at ease by telling you that the lovely ladies at the top of this post are their because their image is one of the most popular uploaded by NARA to date (based on it having been marked a favorite by 88 individuals). The only image I could find with more fans was the classic image of Nixon and Elvis with 250 fans at the time of this posting.

What is your favorite NARA Commons image? Please post a link in the comments and if I get enough I will set up a gallery of Spellbound Fan Favorites!

Image Credits: All images within this blog post are pulled from NARA’s images on the Flickr Commons. Please click on the images to see their specific details.

Dipity: Easy Hosted Timelines

Dipity LogoI discovered Dipity via the Reuters article An open-source timeline of the virtual world. The article discusses the creation of a Virtual Worlds Timeline on the Dipity website. Dipity lets anyone create an account and start building timelines. In the case of the Virtual Worlds Timeline, the creator chose to permit others to collaborate on the timeline. Dipity also provides four ways of viewing any timeline: a classic left to right scrolling view, a flipbook, a list and a map.

I chose to experiment by creating a timeline for Spellbound Blog. Dipity made this very easy – I just selected WordPress and provided my blog’s URL. This was supposed to grab my 20 most recent posts – but it seems to have taken 10 instead. I tried to provide a username/password so that Dipity could pull ‘more’ of my posts (they didn’t say how many – maybe all of them?). I couldn’t get it to work as of this writing – but if I figure it out you will see many more than 10 posts.

I particularly like the way they use the images I include in my posts in the various views. I also appreciate that you can read the full posts in-place without leaving the timeline interface. I assume this is because I publish my full articles to my RSS feed. It was also interesting to note that posts that mentioned a specific location put a marker on a map – both within the single post ‘event’ as well as the full map view.

Dipity also supports the streamlined addition of many other sources such as Flickr, Picasa, YouTube, Vimeo, Blogger, Tumblr, Pandora, Twitter and any RSS feed. They have also created some neat mashups. TimeTube uses your supplied phrase to query YouTube and generates a timeline based on the video creation dates. Tickr lets you generate an interactive timeline based on a keyword or user search of Flickr.

Why should archivists care? I always perk up anytime a new web service appears that makes it easy to present time and location sensitive information. I wrote a while ago about MIT’s SIMILE project and I like their Timeline software, but in some ways hosted services like Dipity throw the net wider. I particularly appreciate the opportunity for virtual collaboration that Dipity provides. Imagine if every online archives exhibit included a Dipity timeline? Dipity provides embed code for all the timelines. This means that it should be easy to both feature the timeline within an online exhibit and use the timeline as a way to attract a broader audience to your website.

There has been discussion in the past about creating custom GoogleMaps to show off archival records in a new and different way.  During THATCamp there was a lot of enthusiasm for timelines and maps as being two of the most accessible types of visualizations. By anchoring information in time and/or location it gives people a way to approach new information in a predictable way.

Most of my initial thoughts about how archives could use Dipity related to individual collections and exhibits – but what if an archive created one of these timelines and added an entry for every one of their collections. The map could be used if individual collections were from a single location. The timeline could let users see at a glance what time periods were the focus of collections within that archives. A link could be provided in each entry pointing to the online finding aid for each collection or record group

Dipity is still in working out the kinks of some of their services, but if this sounds at all interesting I encourage you to go take a look at a few fun examples:

And finally I have embedded the Internet Memes timeline below to give you a feel of what this looks like. Try clicking on any of the events that include a little film icon at the bottom edge and see how you can view the video right in place:

Image Credit:  I found and ‘borrowed’ the Dipity image above from Dipity’s About page.

Book Review: Past Time, Past Place: GIS for History

Past Time, Past Place: GIS for History consists mainly of 11 case studies of geographic information systems being applied to the study of history. It includes a nice sprinkling of full color maps and images and a 20 page glossary of GIS terms. Each case study includes a list of articles and other resources for further reading.

The book begins with an introduction by the editor, Anne Kelly Knowles. This chapter explains the basics of using GIS to study history, as well as giving an overview of how the book is organized.

The meat of the book are the case studies covering the following topics:

I suspect that different audiences will take very different ideas away from this book. I was for looking for information about GIS and historical records (this is another book found during my mad hunt for information on the appraisal and preservation of GIS records) and found a bit of related information to add to my research. I think this book will be of interest to those who fall in any of the following categories:

  • Archivists curious about how GIS might enhance access to and understanding of the records under their care
  • Historians interested in understanding how GIS can be used to approach historical research in new ways
  • History buffs who love reading a good story (complete with pictures)
  • Map aficionados curious about new and different kinds of information that can be portrayed with GIS

I especially loved the maps and other images. I am a bit particular when it comes to the quality of graphics – but this book comes through with bright colors and clear images. The unusual square book format (measuring 9″x9″) gave those who arranged the layout lots of room to work – and they took full advantage of the space.

No matter if you plan to read the case studies for the history being brought to life or are looking for “how-tos” as you tackle your own GIS-History project – this book deserves some attention.

GIS and Geospatial Data Preservation: Research Resources

I found these websites while doing research for a paper on the selection and appraisal of geospatial data and geographic information systems (GIS). I hope these links might be useful for others doing similar research.

CIESIN – Center for International Earth Science Information Network at Columbia University, especially Guide to Managing Geospatial Electronic Records (USA)

CUGIR – Cornell University Geospatial Information Repository, especially Collection Development Policy (USA)

Digital Curation Center – supporting UK institutions who store, manage and preserve these data to help ensure their enhancement and their continuing long-term use, especially Curating Geospatial Data, especially Curating Geospatial Data (UK)

Digital Preservation Coalition – “established in 2001 to foster joint action to address the urgent challenges of securing the preservation of digital resources in the UK and to work with others internationally to secure our global digital memory and knowledge base.” Especially their Decision Tree. (UK)

GeoConnections – a Canadian national partnership program to evolve and expand the Canadian Geospatial Data Infrastructure (CGDI). (Canada)

InterPARES 2 Case Studies – especially CyberCartographic Atlas of Antarctica and Preservation of the City of Vancouver GIS Database (VanMap)

Library and Archives of Canada – especially Managing Cartographic, Architectural and Engineering Records in the Government of Canada (Canada)

Library of Congress Digital Preservation – subtitled “The National Digital Information Infrastructure and Preservation Program” (NDIIPP) (USA)

Maine GeoArchives (USA)

Maryland State Geographic Information Committee Standards for Records Preservation

NGDA – the National Geospatial Digital Archive, especially Collection Development Policy For The National Geospatial Digital Archive and UCSB Maps & Imagery Collection Development Policy (USA)

New York State Archives – especially GIS Development Guides: GIS Use and Maintenance (USA)

North Carolina Center for Geographic Information and Analysis (USA)

North Carolina Geospatial Data Archiving Project – especially their NDIIPP proposal for Collection and Preservation of At Risk Digital Geospatial Data (USA)

OMB Circular No. A-16 – which requires the development of the National Spatial Data Infrastructure (NSDI) by the Federal Geographic Data Committee (FGDC) (USA)

Any great sites I am missing? Please let me know and I will add to the list.

The Edges of the GIS Electronic Record

I spent a good chunk of the end of my fall semester writing a paper ultimately titled “Digital Geospatial Records: Challenges of Selection and Appraisal”. I learned a lot – especially with the help of archivists out there on the cutting edge who are trying to find answers to these problems. I plan on a number of posts with various ideas from my paper.

To start off, I want to consider the topic of defining the electronic record in the context of GIS. One of the things I found most interesting in my research was the fact that defining exactly what a single electronic record consists of is perhaps one of the most challenging steps.

If we start with the SAA’s glossary definition of the term ‘record’ we find the statement that “A record has fixed content, structure, and context.” The notes go on to explain:

Fixity is the quality of content being stable and resisting change. To preserve memory effectively, record content must be consistent over time. Records made on mutable media, such as electronic records, must be managed so that it is possible to demonstrate that the content has not degraded or been altered. A record may be fixed without being static. A computer program may allow a user to analyze and view data many different ways. A database itself may be considered a record if the underlying data is fixed and the same analysis and resulting view remain the same over time.

This idea presents some major challenges when you consider data that does not seem ‘fixed’. In the fast moving and collaborative world of the internet, Geographic Information Systems are changing over time – but the changes themselves are important. We no longer live in a world in which the way you access a GIS is via a CD which has a specific static version of the map data you are considering.

One of the InterPARES 2 case studies I researched for my paper was the Preservation of the City of Vancouver GIS database (aka VanMap). Via a series of emails exchanged with the very helpful Evelyn McLellan (who is working on the case study) I learned that the InterPARES 2 researchers concluded that the entire VanMap system is a single record. This decision was based on the requirement of ‘archival bond’ to be present in order for a record to exist. I have included my two favorite definitions of archival bond from the InterPARES 2 dictionary below:

archival bond
n., The network of relationships that each record has with the records belonging in the same aggregation (file, series, fonds). [Archives]

n., The originary, necessary and determined web of relationships that each record has at the moment at which it is made or received with the records that belong in the same aggregation. It is an incremental relationship which begins when a record is first connected to another in the course of action (e.g., a letter requesting information is linked by an archival bond to the draft or copy of the record replying to it, and filed with it. The one gives meaning to the other). [Archives]

I especially appreciate the second definition above because it’s example gives me a better sense of what is meant by ‘archival bond’ – though I need to do more reading on this to get a better grasp of it’s importance.

Given the usage of VanMap by public officials and others, you can imagine that the state of the data at any specific time is crucial to determining the information used for making key decisions. Since a map may be created on the fly using multiple GIS layers but never saved or printed – it is only the knowledge that someone looked at the information at a particular time that would permit those down the road to look through the eyes of the decision makers of the past. Members of the VanMap team are now working with the Sustainable Archives & Library Technologies (SALT) lab at the San Diego Supercomputer Center (SDSC) to use data grid technology to permit capturing the changes to VanMap data over time. My understanding is that a proof of concept has been completed that shows how data from a specific date can be reconstructed.

In contrast with this approach we can consider what is being done to preserve GIS data by the Archivist of Maine in the Maine GeoArchives. In his presentation titled “Managing GIS in the Digital Archives” delivered at the 2006: Joint Annual Meeting of NAGARA, COSA, and SAA on August 3, 2006, Jim Henderson explained their approach of appraising individual layers to determine if they should be accessioned in the archive. If it is determined that the layer should be preserved, then issues of frequency of data capture are addressed. They have chosen a pragmatic approach and are currently putting these practices to the test in the real world in an ambitious attempt to prevent data loss as quickly as is feasible.

My background is as a database designer and developer in the software industry. In my database life, a record is usually a row in a database table – but when designing a database using Entity-Relationship Modeling (and I will admit I am of the “Crow’s Feet” notation school and still get a smile on my face when I see the cover of the CASE*Method: Entity Relationship Modelling book) I have spent a lot of time translating what would have been a single ‘paper record’ into the combination of rows from many tables.

The current system I am working on includes information concerning legal contracts. Each of these exists as a single paper document outside the computers – but in our system we distribute information that is needed to ‘rebuild’ the contract into many different tables. One for contact information – one for standard clauses added to all the contracts of this type – another set of tables for defining financial formulas associated with the contract. If I then put on my archivist hat and I didn’t just choose to keep the paper agreement, I would of course draw my line around all these different records needed to rebuild the full contract. I see that there is a similar definition listed as the second definition on the InterPARES 2 Terminology Dictionary for the term ‘Record‘:

n., In data processing, a grouping of interrelated data elements forming the basic unit of a file. A Glossary of Archival and Records Terminology (The Society of American Archivists)

Just in this brief survey we can see three very different possible views on where to draw a line around what constitutes a single Geographic Information System electronic record. Is it the entire database, a single GIS layer or some set of data elements which create a logical record? Is it worthwhile trying to contrast the definition of a GIS record with the definition of a record when considering analog paper maps? I think the answer to all of these questions is ‘sometimes’.

What is especially interesting about coming up with standard approaches to archiving GIS data is that I don’t believe there is one answer. Saying ‘GIS data’ is about as precise as saying ‘database record’ or ‘entity’ – it could mean anything. There might be a best answer for collaborative online atlases.. and another best answer for state government managed geographic information library.. and yet another best answer for corporations dependent on GIS data for doing their business.

I suspect that it will be via thorough analysis of the information stored in a GIS system, how it is/was created, how often it changes and how it was used that will determine the right approach for archiving these born digital records. There are many archivists (and IT folks and map librarians and records managers) around the world who have a strong sense of panic over the imminent loss of geospatial data. As a result, people from many fields are trying different approaches to stem the loss. It will be interesting to consider these varying approaches (and their varying levels of success) over the next few years. We can only hope that a few best practices will rise to the top quickly enough that we can ensure access to vital geospatial records in the future.